Examples
Example 1
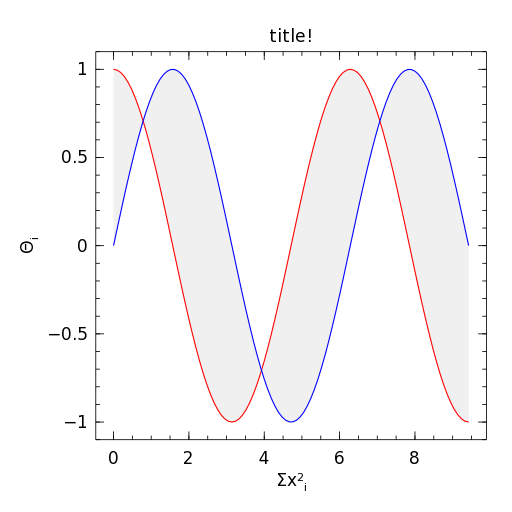
 x = linspace(0, 3pi, 100)
 c = cos.(x)
 s = sin.(x)

 p = FramedPlot(
         title="title!",
         xlabel="\\Sigma x^2_i",
         ylabel="\\Theta_i")

 add(p, FillBetween(x, c, x, s))
 add(p, Curve(x, c, color="red"))
 add(p, Curve(x, s, color="blue"))
Example 2
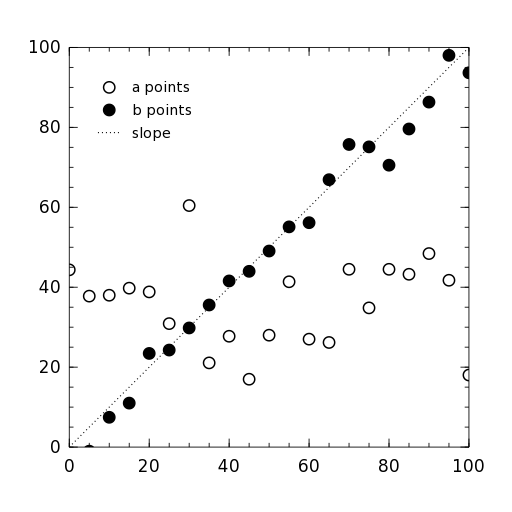
 p = FramedPlot(
         aspect_ratio=1,
         xrange=(0,100),
         yrange=(0,100))

 n = 21
 x = linspace(0, 100, n)
 yA = 40 .+ 10randn(n)
 yB = x .+ 5randn(n)

 a = Points(x, yA, kind="circle")
 setattr(a, label="a points")

 b = Points(x, yB)
 setattr(b, label="b points")
 style(b, kind="filled circle")

 s = Slope(1, (0,0), kind="dotted")
 setattr(s, label="slope")

 l = Legend(.1, .9, [a,b,s])

 add(p, s, a, b, l)
Example 3
 p = FramedPlot(
         title="Title",
         xlabel="X axis",
         ylabel="Y axis")

 add(p, Histogram(hist(randn(1000))...))
 add(p, PlotLabel(.5, .5, "Histogram", color=0xcc0000))

 t1 = Table(1, 2)
 t1[1,1] = p
 t1[1,2] = p

 t2 = Table(2, 1)
 t2[1,1] = t1
 t2[2,1] = p

Example 4
 x = linspace(0., 2pi, 40)
 s = sin.(x)
 c = cos.(x)

 inset = FramedPlot(title="inset")
 setattr(inset.frame, draw_ticks=false)

 add(inset, Curve(x, s, kind="dashed"))

 p = FramedPlot(aspect_ratio=1)
 setattr(p.frame, tickdir=+1, draw_spine=false)

 add(p, SymmetricErrorBarsY(x, s, 0.2*ones(length(x))))
 add(p, Points(x, s, color="red"))
 add(p, PlotInset((.6,.6), (.95,.95), inset))

Example 5
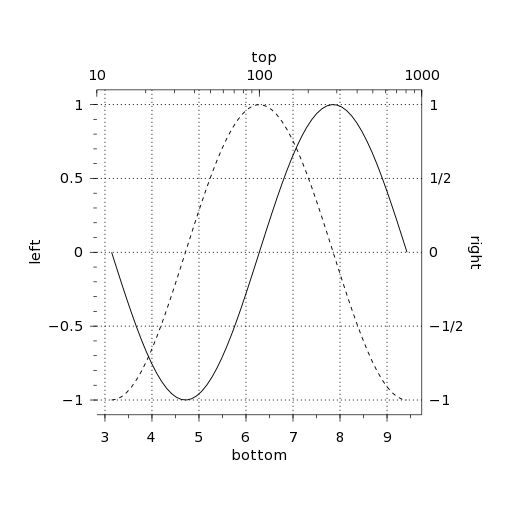
 x = linspace(pi, 3pi, 60)
 c = cos.(x)
 s = sin.(x)

 p = FramedPlot(aspect_ratio=1)
 setattr(p.frame1, draw_grid=true, tickdir=1)

 setattr(p.x1, label="bottom", subticks=1)
 setattr(p.y1, label="left", draw_spine=false)
 setattr(p.x2, label="top", range=(10,1000), log=true)

 setattr(p.y2, label="right", draw_ticks=false,
     ticklabels=["-1", "-1/2", "0", "1/2", "1"])

 add(p, Curve(x, c, kind="dash"))
 add(p, Curve(x, s))