Winston
latest
Functions
closefig
colormap
figure
fplot
Example
gcf
hold
imagesc
loglog
oplot
plot
plothist
plothist2d
savefig
scatter
semilogx
semilogy
stem
text
title
timeplot
xlabel
xlim
ylabel
ylim
Frequently Asked Questions
Objects
Examples
Winston
Docs
»
Functions
»
fplot
Edit on GitHub
fplot
fplot
(
f::Function
,
limits
[
,
spec
]
)
Plot the function
f
between the specified
limits
.
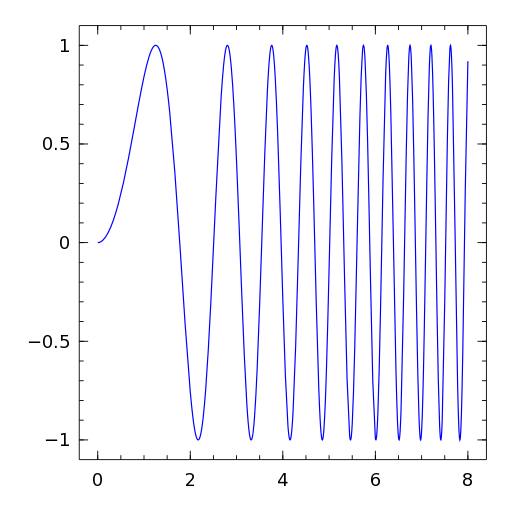
Example
fplot
(
x
->
sin
(
x
^
2
),
[
0
,
8
],
"b"
)