plothist
Plot a histogram of args. args is transformed into a tuple (edges, counts) using the hist function from Base.
args
(edges, counts)
hist
Base
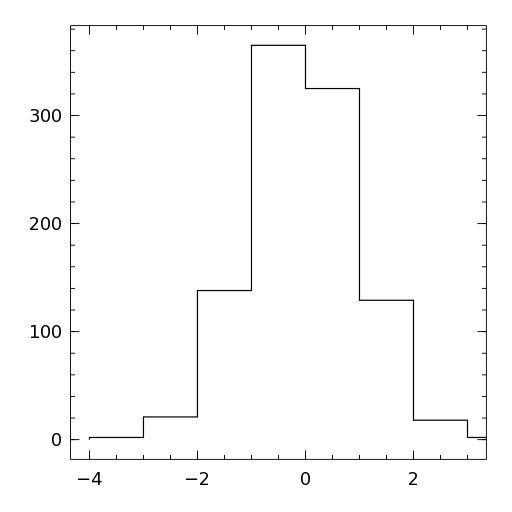
x = randn(1000)
plothist(x)