PlotLabel
PlotComponent to add a label with text given by str at position (x, y). The coordinates x and y are normalized to range between 0 and 1. args and kvs can be used to set additional style attributes.
PlotComponent
str
(x, y)
x
y
args
kvs
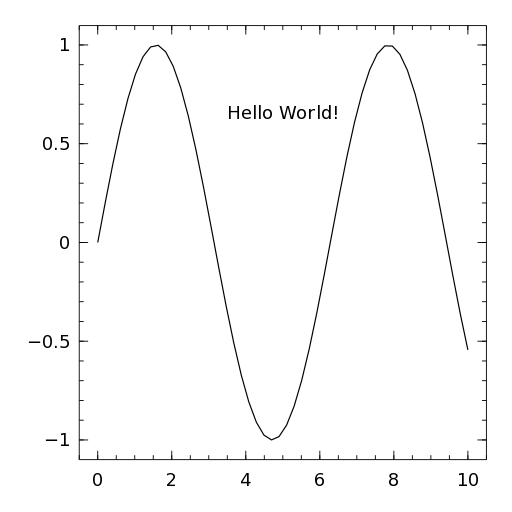
x = linspace(0, 10)
p = plot(x, sin.(x))
l = PlotLabel(0.5, 0.8, "Hello World!")
add(p, l)