timeplot
-
timeplot(p::FramedPlot, x::Array{DateTime, 1}, y::AbstractArray{T, N}, args...; kvs...) -
timeplot(x::Array{DateTime, 1}, y::AbstractArray{T, N}, args...; kvs...) -
timeplot(p::FramedPlot, x::Array{Date, 1}, y::AbstractArray{T, N}, arg...; kvs...) -
timeplot(x::Array{Date, 1}, y::AbstractArray{T, N}, arg...; kvs...) Plot a time series where the time is given as a Julia
DateTimeorDatetype. The keyword argumentformatmay be used to specify a date formatting string and is passed tostrftimeto format the ticklabels of the x axis. Additional arguments and keyword arguments are passed toplot.
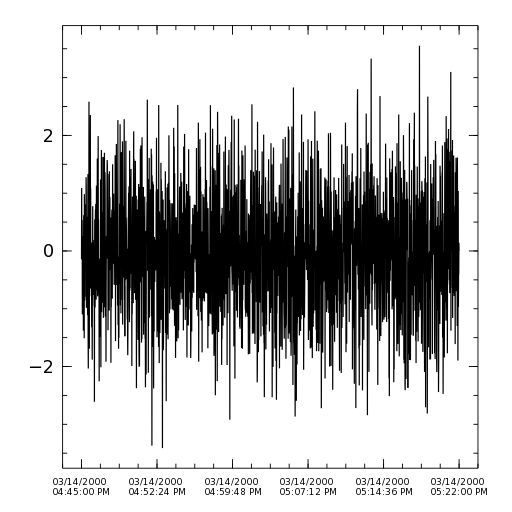
Example
using Base.Dates

t0 = DateTime(Year(2000), Month(3), Day(14), Hour(21), Minute(45))
t1 = DateTime(Year(2000), Month(3), Day(14), Hour(22), Minute(22))

x = collect(t0:Second(1):t1)
y = randn(length(x))

timeplot(x, y, format="%x\n%X")